TWP 1.0 Indicator
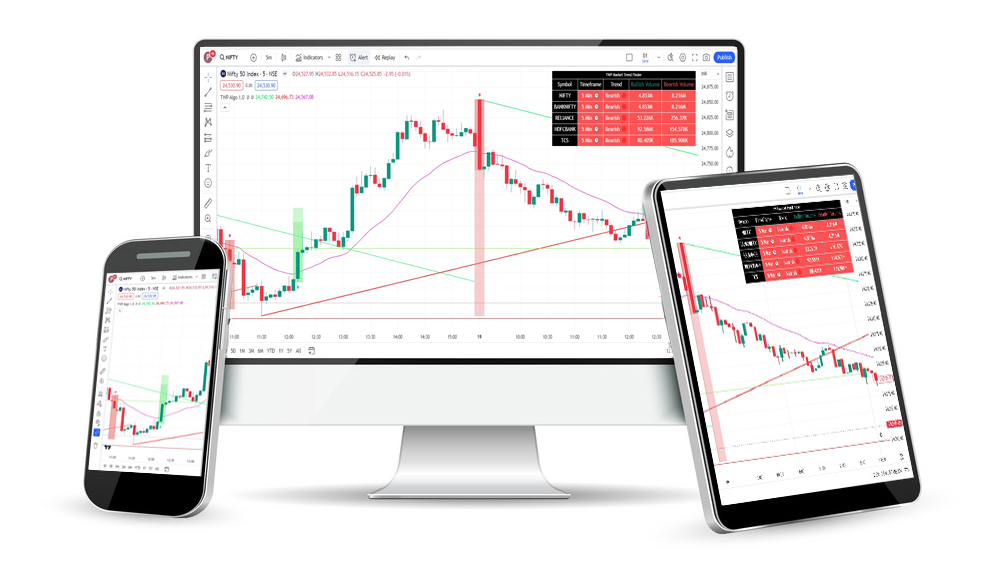
TWP Algorithm 1.0 information
- TWP Algorithm 1.0 tells the trend of the market.
- TWP Algorithm 1.0 provides you buy and sell zones in the live market according to the past data of the market.
- TWP Algorithm 1.0 tells you automatic fixed and variable support and resistance levels based on past market data.
- TWP Algorithm 1.0 automatically shows you the ascending and descending lines according to the previous data.
- TWP Algorithm 1.0 will tell you the market trend on a single chart.
Works on every device & all segments also
- TWP Algorithm 1.0 will work on Tradingview Platform
- TWP Algorithm 1.0 use on any browser/device like Chrome, Safari, Android & iOS applications.
- TWP Algorithm 1.0 used in all segments Equity, F & O, Commodities, Crypto and works on all charts in TradingView.
Trend & Extra Zone Finder
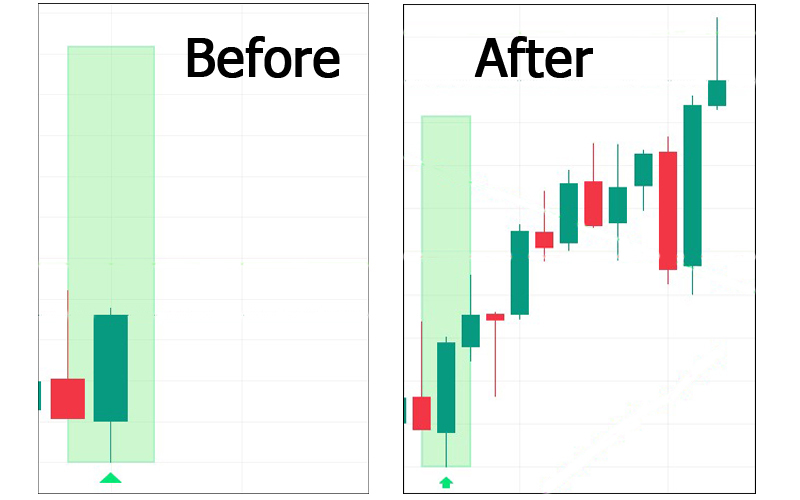
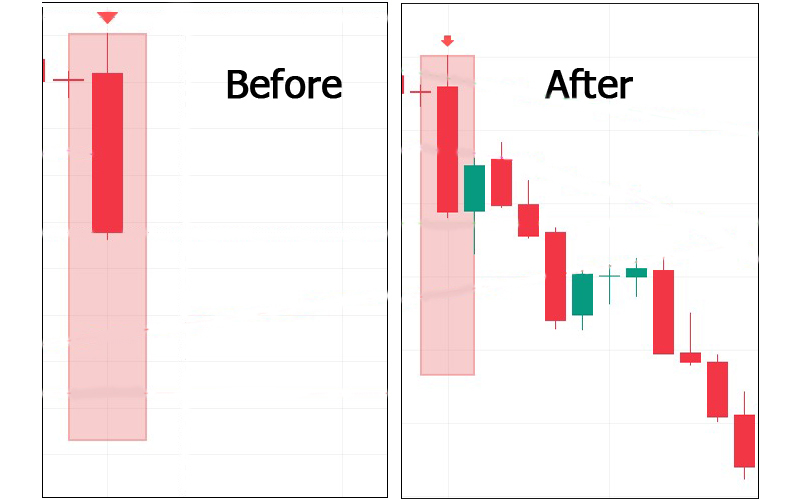
TWP Algorithm 1.0 will create uptrend and downtrend zones for you in the live market.
Uptrend Zone
Green Zone indicates uptrend.
Downtrend Zone
Red Zone indicates Downtrend.
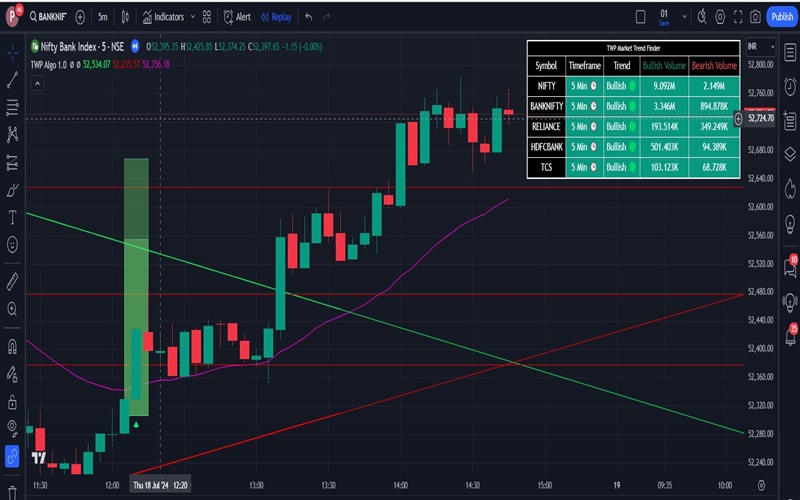
Market Trend Finder in Single Chart
TWP Algorithm 1.0 will provide you with a chart that will show you the market trend across all time frames.
Bullish trend
If the chart shows a bullish trend, it indicates a bullish trend in the market.
Bearish trend
If the chart shows a bearish trend, it indicates a bearish trend in the market.
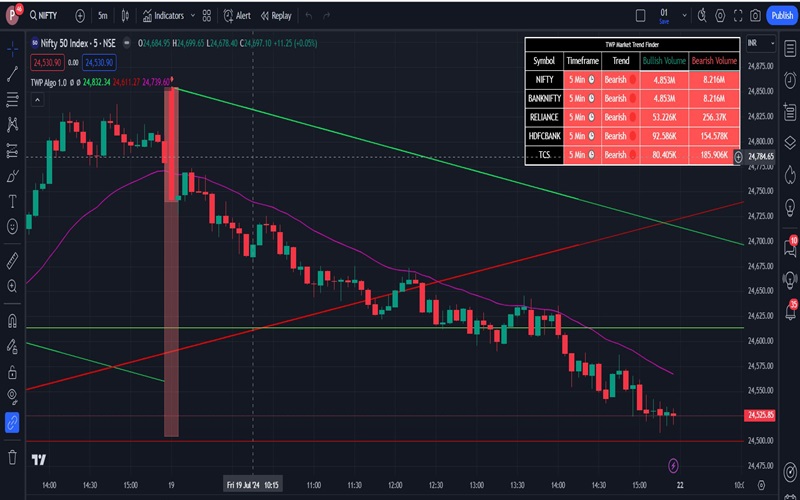
Market Trend Finder
TWP Algorithm 1.0 draws a pink line which tells you the trend of the market.
Bullish trend
Any segment above the pink line indicates a bullish trend.

Bearish trend
Any segment below the pink line indicates a bearish trend.

Support & Resistance Finder
TWP Algorithm 1.0 shows you fixed and variable support and resistance levels in the live market calculated on the Previous chart pattern.
Support
The red line tells the support level of the market, if the market breaks the support level then the support becomes resistance and the red line will be replaced by green.

Resistance
The green line tells the resistance level of the market, if the market breaks the resistance level then the resistance becomes support and the green line will be replaced by red.

Ascending & Descending Trend Line Finder
TWP Algorithm 1.0 creates ascending and descending lines automatically by looking at the charts in the live market.
Ascending Lines
If the market breaks the ascending line, then we see selling and ascending line will show you red color

Descending Lines
If the market breaks the descending line, we get to buy and descending line will show you green color

Examples


FAQs
Get instant access of the
TWP 1.0 Indicator for life time at 2999/- Only
(+18% GST include this price)
( This Price is offer Price, offer is valid till 12 midnight so book your license quickly )
